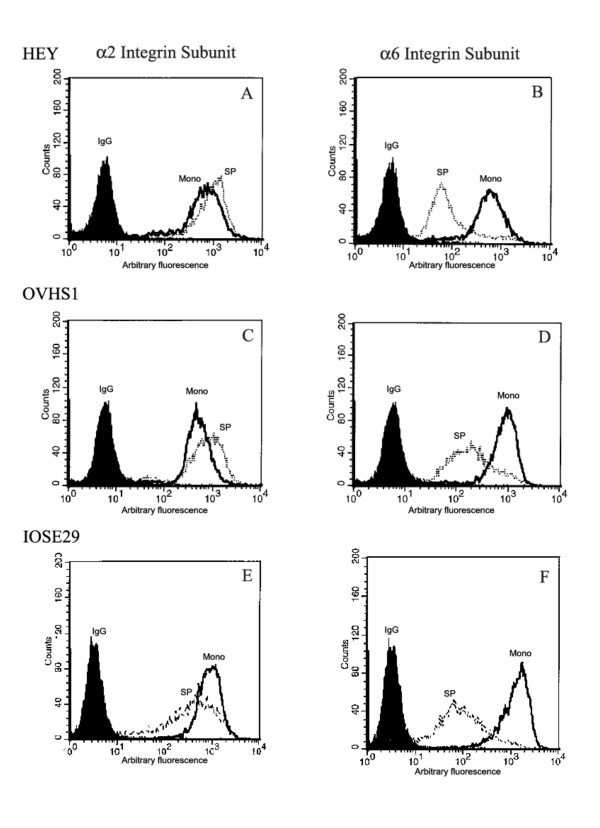
Figure 6.
Flow cytometric analyses of α2 and α6 integrin subunits in HEY (A and B), OVHS1 (C and D) and IOSE29 (E and F) cells grown as a monolayer and as spheroids (4 days for HEY and OVHS1 cells and 2 days for IOSE29 cells). Cells were incubated with either control IgG or primary α2 or α6 monoclonal antibody followed by secondary goat anti-mouse IgG conjugated with phycoerythrin. The mean intensity of fluorescence (MIF, arbitary units, log scale) was measured. The filled histogram in each figure is control IgG, black lines indicate the expression of protein in monolayer cells while broken lines demonstrate protein expression within the cells in spheroids. Results are representative of three independent experiments. Monolayer = mono, spheroid = Sp

