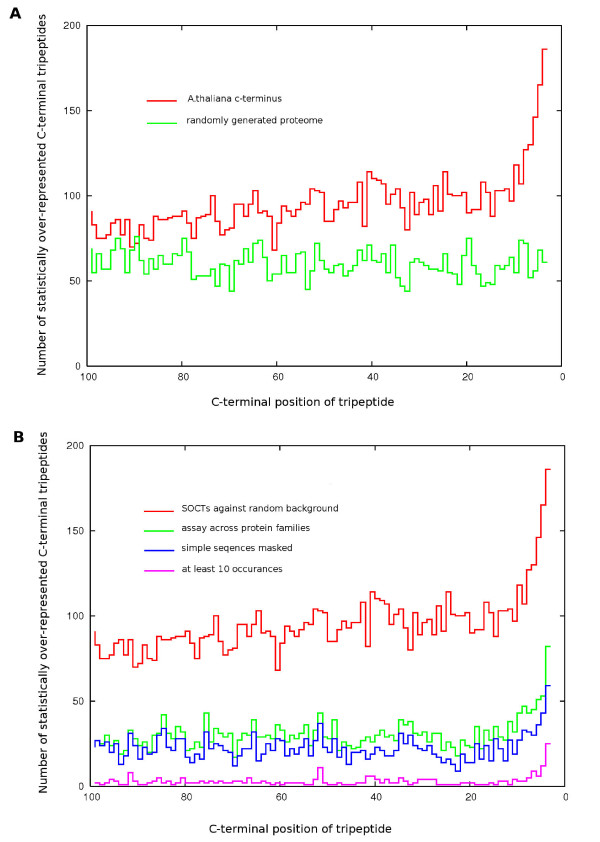
Figure 2.
Position-specific abundance of SOCTs in A. thaliana. Graphical depictions of the number of statistically over-represented C-terminal tripeptides (z ≥ 3) occurring in the C-terminal region (-3 to -100). A. The unfiltered assessment of statistical over-representation in the C-terminus, as compared to a randomized data set control. B. The reduction in site-specific SOCT abundance after successive rounds of filtering measures including sequence masking, protein family adjustment and the stipulation of at least 10 occurrences for each SOCT.

