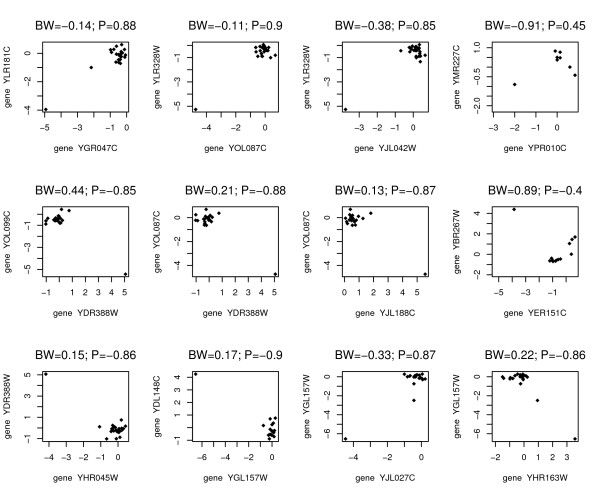
Figure 5.
Each point represents the log2 (R/G) value for the specified genes on a particular array. Each panel again shows the relationship between two genes whose biweight and Pearson correlations differ. Here we measure the actual difference between the Pearson correlation and biweight correlation. Each of the 12 pairs of genes had an absolute correlation difference of at least 1.0 and one of the correlations had an absolute value of at least 0.85.

