
Figure 4.
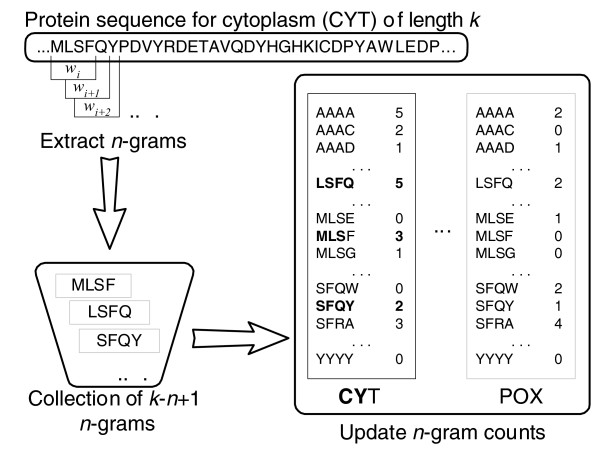
The n-gram model for representing proteins in ngLOC. This figure depicts the process of extracting n-grams from an example protein sequence for cytoplasm (CYT), and shows how the table of frequencies of n-grams maintained by the model is updated accordingly. For this example, n = 4. The n-grams in bold indicate updated table entries as a result of processing the sequence. POX, perixosome.