
Figure 1.
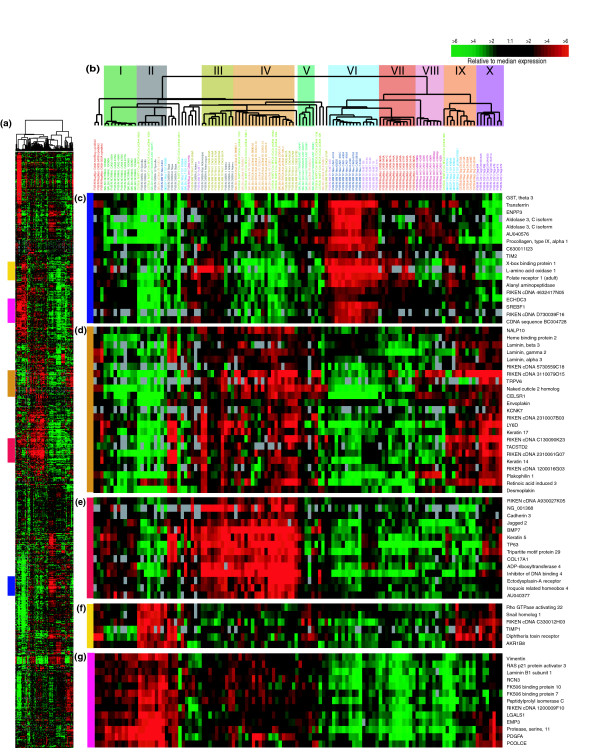
Mouse models intrinsic gene set cluster analysis. (a) Overview of the complete 866 gene cluster diagram. (b) Experimental sample associated dendrogram colored to indicate ten groups. (c) Luminal epithelial gene expression pattern that is highly expressed in TgMMTV-PyMT, TgMMTV-Neu, and TgWAP-myc tumors. (d) Genes encoding components of the basal lamina. (e) A second basal epithelial cluster of genes, including Keratin 5. (f) Genes expressed in fibroblast cells and implicated in epithelial to mesenchymal transition, including snail homolog 1. (g) A second mesenchymal cluster that is expressed in normals. See Additional data file 2 for the complete cluster diagram with all gene names.