. 2007 May 1;8(5):R69. doi: 10.1186/gb-2007-8-5-r69

Figure 3.

Figure 3

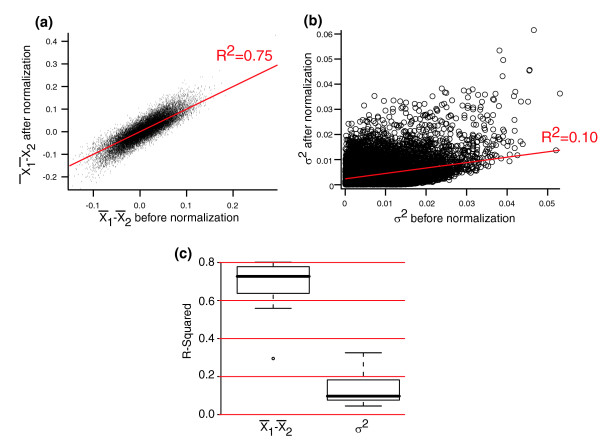
Estimates of standard error do not survive quantile-quantile normalization. (a,b) x¯1x¯2 MathType@MTEF@5@5@+=feaafiart1ev1aaatCvAUfeBSjuyZL2yd9gzLbvyNv2Caerbhv2BYDwAHbqedmvETj2BSbqee0evGueE0jxyaibaiKI8=vI8tuQ8FMI8Gi=hEeeu0xXdbba9frFj0=OqFfea0dXdd9vqai=hGuQ8kuc9pgc9s8qqaq=dirpe0xb9q8qiLsFr0=vr0=vr0dc8meaabaqaciGacaGaaeqabaqadeqadaaakeaaieaaceWF4bGbaebadaWgaaWcbaGaaGymaaqabaGccqGHsislceWF4bGbaebadaWgaaWcbaGaaGOmaaqabaaaaa@381E@ (panel a) and σ2 (panel b) before and after background correction and quantile-quantile normalization for the comparison of the Latin Square experiments 1 and 2. Fits shown are to a linear regression. (c) Box plot showing the R2 values from a linear fit for all 14 2× Latin Square comparisons.