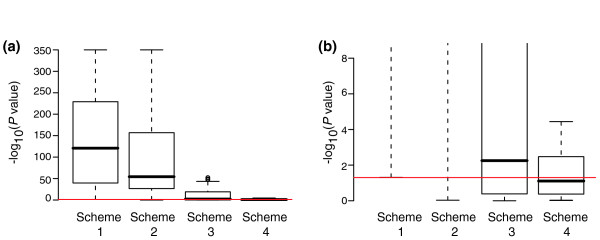
Figure 7.

Actual versus expected P values for a technical replicate dataset. Shown are results of the Kolmogorov-Smirnov test for all 40 possible n = 3 versus n = 3 combinations of the technical replicates from the dataset of Cope and coworkers [16]. The null hypothesis for the Kolmogorov-Smirnov test is that the observed P values are identical to a uniform distribution. The red line is the P = 0.05 level. (a,b) The same data are shown in both panels but panel b has a magnified y-axis.
