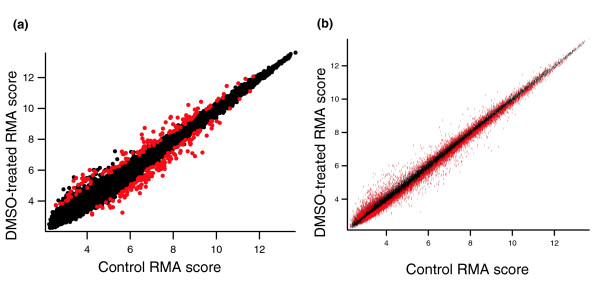
Figure 9.

Positives at 10% FDR identified by scheme 4 and the standard t test. Shown are the averages of RMA scores across the five replicates comparing baseline (DMSO only) and experiment (DMSO + drug) for myeloid cells 4 hours after treatment. The same data are shown in both panels. (a,b) Red symbols show genes called significant in Table 1 from (panel b) the standard t test (scheme 1) and (panel a) under scheme 4 at a 10% false discovery rate (FDR), as calculated using the Benjamini and Hochberg algorithm.
