
Figure 10.
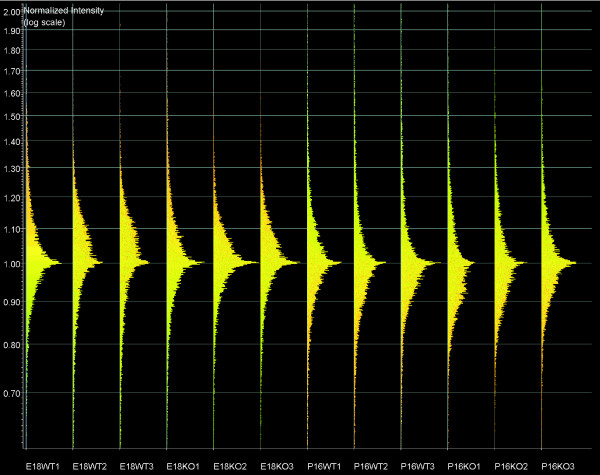
Distribution of normalized signal intensities on all microarrays used (per chip normalization to 50th percentile). Highly similar intensity patterns were observed for all chips used in this study, confirming that all microarray chips in these experiments are comparable. E, embryonic day; KO, knockout (Nfia-/-); P, postnatal day; WT, wild-type (Nfia+/+).