
Figure 2.
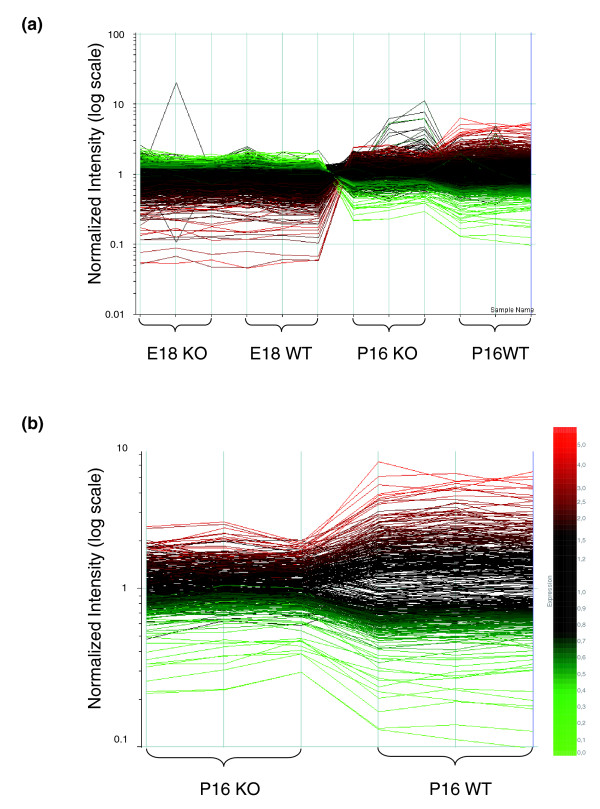
Overall gene expression level in both E18 and P16 Nfia+/+ and Nfia-/- mice. (a) All probe sets. (b) The 395 probe sets significantly changed in postnatal day (P)16 Nfia-/- relative to P16 Nfia+/+ samples. Each curve represents one probe set, and each intercept on the x-axis represents one chip. Two normalization steps were performed. First, normalization across the whole array was carried out in order to correct for variations of average signal intensity. Second, the mean signal intensity of each individual probe set on all 12 chips was set to 1. Taking the rightmost chip on the x-axis ('P16WT3') as a reference (blue line), colors were assigned to the curves representing probe sets. The higher the signal intensity is on this reference chip, the more red the color; similarly, and the lower the signal intensity, the more green is the curve's color (following the spectrum given on the right). KO, knockout (Nfia-/-); WT, wild-type (Nfia+/+).