
Figure 5.
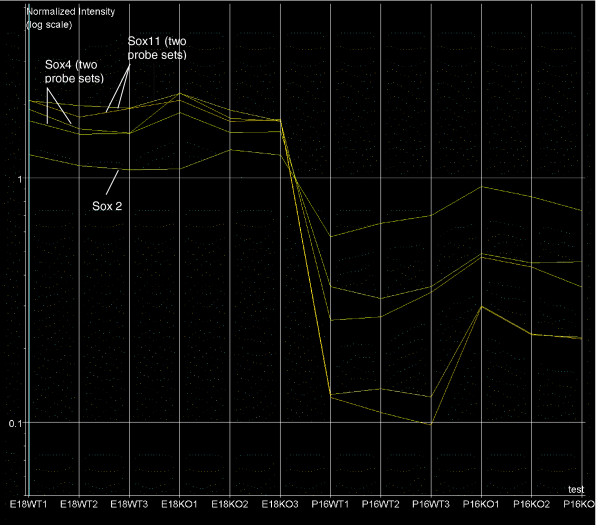
mRNA expression levels of Sox2, Sox4, and Sox11. Shown are mRNA expression levels of the oligodendrocyte precursor genes Sox2, Sox4, and Sox11 in embryonic day (E)18 and postnatal day (P)16 Nfia-/- and Nfia+/+ mice according to microarray analysis. The line graphs of signal intensities demonstrate that expression levels of these genes decrease from E18 to P16 in both genotypes, but that the reduction in expression is less pronounced in Nfia-/- animals. KO, knockout (Nfia-/-); WT, wild-type (Nfia+/+).