
Figure 3.
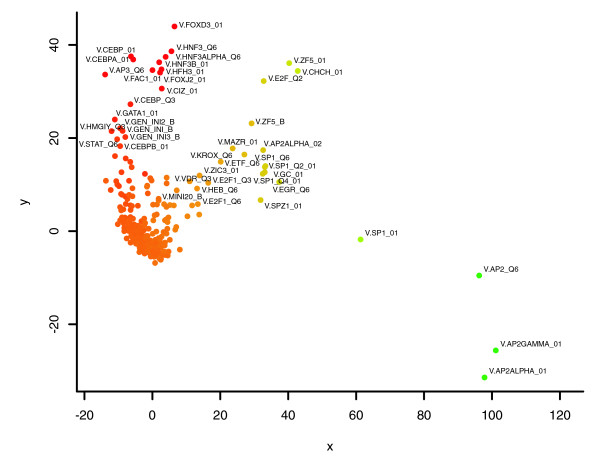
DDM-MDS plot of the TFBS associations found in the p53 dataset. Associated with up-regulation we find binding sites for several CEBPs, STATs and HNFs. Associated with down-regulation we observe binding sites for E2F, ZF5 AP-2alpha and AP-2gamma. The parameters for Match were set to 0.9 for core similarity and 0.75 for matrix similarity. See Figure 2 for the procedure followed.