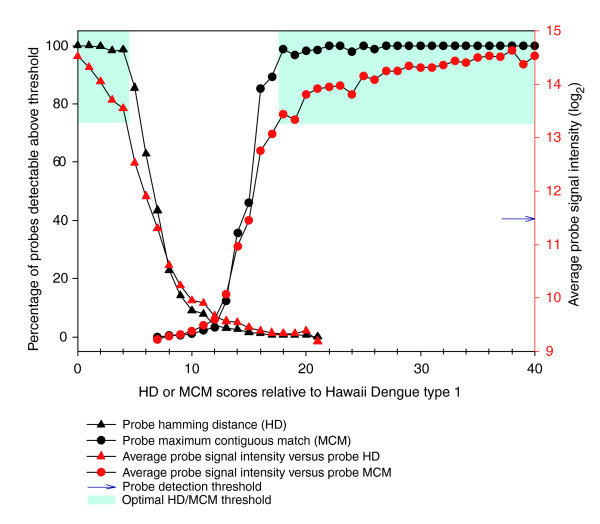
Figure 2.

Relationship between probe HD, probe MCM and probe signal intensity. Average probe signal intensity and percentage of detectable probes (signal intensity > mean + 2 SD) decreases as HD increases and MCM decreases. The optimal cross-hybridization thresholds HD ≤ 4 or MCM ≥ 18, where >98% of probes can be detected, is shaded in blue.
