Figure 5.

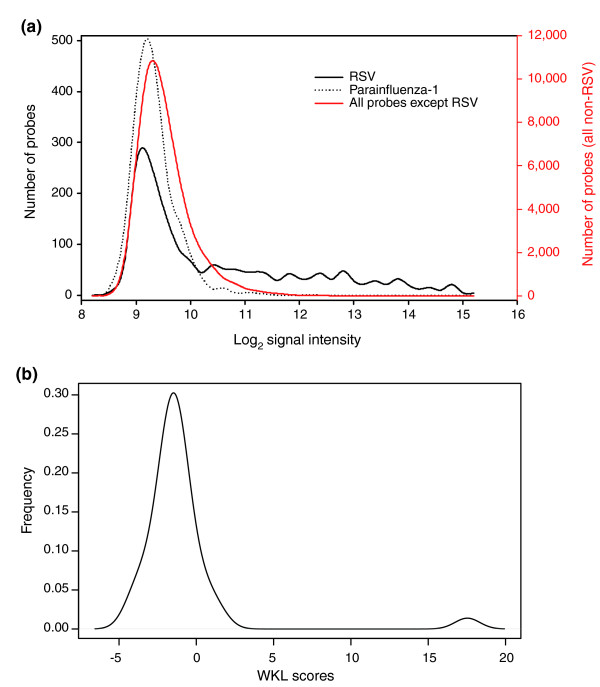
Distribution of probe signal intensities and WKL scores. RNA isolated from a RSV-infected patient was hybridized onto the array. (a) Distribution of probe signal intensities of all 53,555 probes (red) and r-signature probes for an absent pathogen, for example, parainfluenza-1 (dotted line), show a normal distribution. The distribution of signal intensity for RSV r-signature probes are positively skewed, with higher signal intensities in the tail of the distribution. (b) Distribution frequency of WKL scores for the 35 pathogen r-signatures with the majority ranging between -5 and 3. A non-normal WKL score distribution is observed (P < 0.05 by Anderson Darling test). The presence of a pathogen is indicated by a non-normal distribution caused by outlier WKL = 17, corresponding to RSV. Excluding the RSV r-signature WKL score results in a normal distribution. From this computation, we conclude that RSV is present in the hybridized sample.
