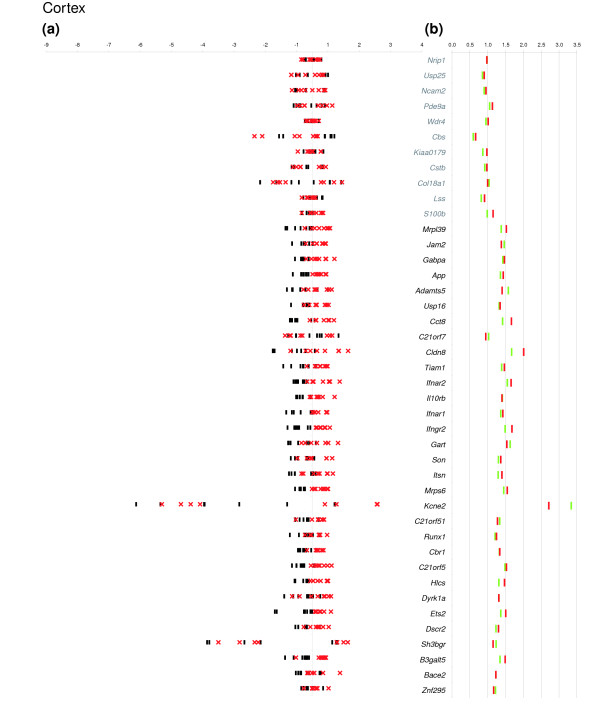
Figure 3.

Relative expression and mean Ts65Dn/euploid ratio plots in cortex. (a) For each of eight Ts65Dn mice (red crosses) and eight euploid mice (black dashes), the log2 ratio of the individual normalized expression over the mean expression across all individuals is plotted on the x-axis. When values for different individuals of a given population are very close, they cannot be distinguished on the graph. On the y-axis each expressed gene is represented in chromosomal order. (b) We plotted the mean Ts65Dn/euploid ratios obtained by electronic pooling (red dashes) and the mean Ts65Dn/euploid ratio obtained from a biologic pool (green dashes). The fold changes are given on the x-axis and the gene names on the y-axis. When values for different individuals of a given population are the same, they cannot be distinguished on the graph. Names of genes that are triplicated in Ts65Dn are in bold and disomic genes in grey.
