
Figure 2. Pharmacokinetics of PAP-1.
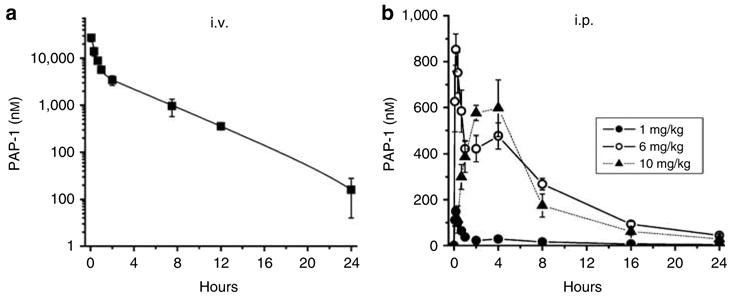
(a) Total PAP-1 plasma concentrations in Lewis rats (n = 3) following intravenous injection at 6mg/kg. The data were fitted as a second-order exponential decay for a two-compartment model with Winnonlin® software (y = A×exp−αxt+B ×exp−βxt where A = 9.58±0.72, B = 2.00±0.16, α = 3.18±0.33 hours−1 and β = 0.23±0.01 hours−1; K10 = 0.99±0.06 hours−1, K12 = 1.68±0.23 hours−1, and K21 = 0.74±0.09 hours−1; steady-state volume of distribution Vss = 1.6±0.06 l/kg. (b) Total PAP-1 plasma concentrations following i.p. injection at 1 (●), 6 (○), or 10 (▴) mg/kg (n = 3 for each concentration). All values are given as the mean±SEM of total PAP-1 concentrations.