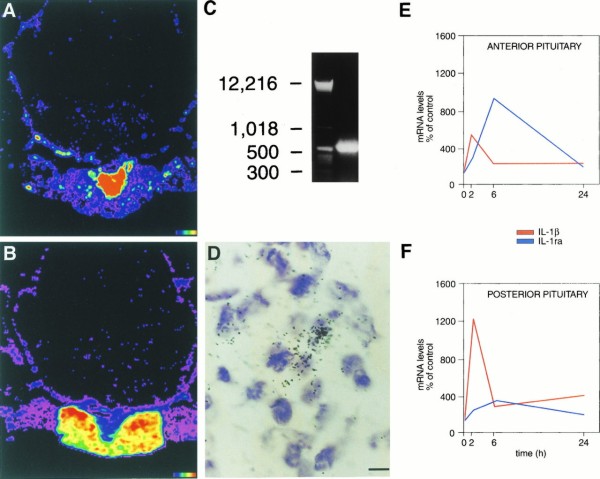
Figure 3.

Induction of IL-1β mRNA and IL-1ra mRNA in the pituitary after LPS treatment. Computer-generated pseudocolor images are shown in A for IL-1β and in B for IL-1ra; images show peak induction of IL-1β mRNA 2 h after LPS administration (A) and of IL-1ra mRNA 6 h after LPS administration (B). Note that IL-1β mRNA induction occurs predominantly in the posterior pituitary (A) and that IL-1ra mRNA induction occurs predominantly in the anterior pituitary (B). (C) Photograph of an agarose gel containing RT-PCR product of RNA obtained from pituitaries of rats treated with LPS 6 h after i.p. injection. The gel showed a single band of the expected size (≈537 bp) for sIL-1ra; cloning and sequencing of the PCR product confirmed the specific sequence of sIL-1ra (16, 22). (D) High magnification image of IL-1ra mRNA hybridization in the anterior pituitary; black dots represent silver grains overlying IL-1ra mRNA. (E and F) Graphics show the time course for the induction of IL-1β mRNA (red line) and IL-1ra mRNA (blue line) in the anterior pituitary (E) and in the posterior pituitary (F) at 0, 2, 6, and 24 h after LPS administration, using quantitative densitometry from autoradiographic images. Using ANOVA with post hoc correction we found that both in the anterior and in the posterior pituitary increases in mRNA levels over time-matched control values were significant for IL-1β at the 0.0001 level at 2 h and at the 0.05 level at 6 and 24 h, and for IL-1ra at the 0.05 level at 2 h and at the 0.0001 level at 6 h; at 24 h IL-1ra mRNA levels were the same in LPS and saline-treated groups. (Color scale for A and B: black indicates background and red indicates areas of highest hybridization levels. Bar = 5 μm in D.)
