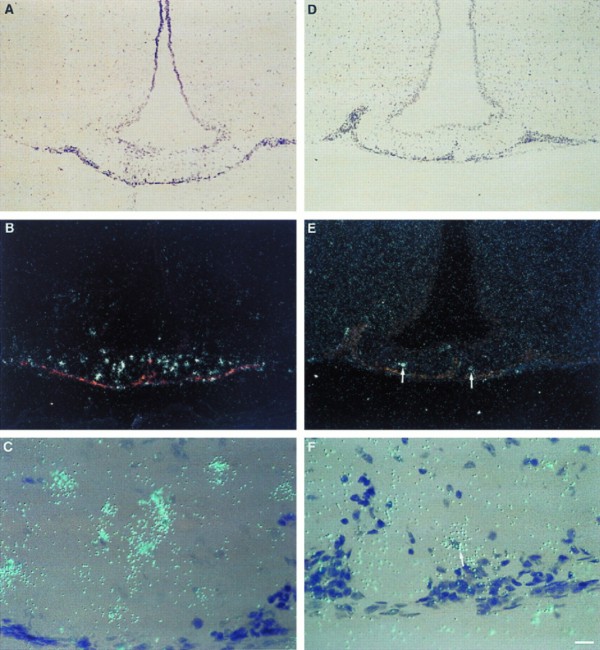
Figure 4.

Induction of IL-1β mRNA and IL-1ra mRNA in the median eminence (ME) after treatment with i.p. LPS. IL-1β mRNA is shown in the first column (A–C), and IL-1ra mRNA is shown in the second column (D–F). There is a remarkable induction of IL-1β mRNA in the ME after LPS administration, while the induction of IL-1ra mRNA is present, but substantially less intense. The time points shown, 2 h for IL-1β (A–C) and 6 h for IL-1ra (D–F), represent the peak of mRNA induction in the ME for IL-1β and IL-1ra, respectively. Low magnification darkfield pictures of the ME are depicted in B and E, the corresponding brightfield pictures are depicted in A and D. C and F show high magnification pictures of the ME. White dots (B and E) or blue dots (C and F) represent silver grains overlying mRNA; arrow in F points to a cell overexpressing IL-1ra mRNA. (Bar = 70 μm in A, B, D, E, and 9 μm in C and F.)
