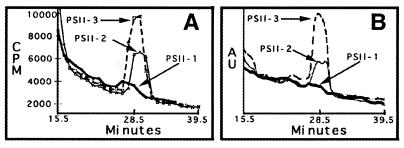
Figure 4.
Chromatogram showing the purification of [14C]benzaldehyde from PSII. In A and B, the distribution of 14C and the absorbance at 254 nm are plotted versus elution time, respectively. The elution time for the benzaldehyde standard was 28.5 ± 1.0 min; 14C (A) and UV (B) peaks coeluted with the benzaldehyde standard run on that same day. A and B show PSII-1 (boldface line), PSII-2 (solid line), and PSII-3 (dashed line).

