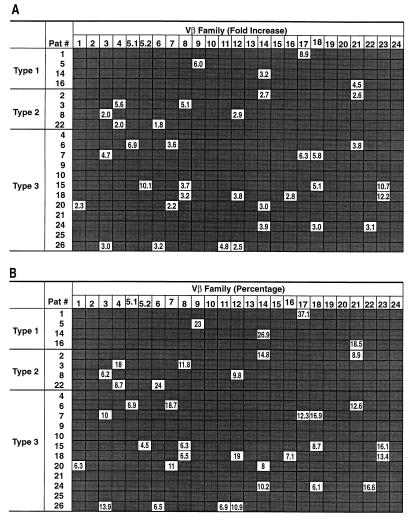
Figure 2.
Analysis of the Vβ repertoire in 21 individuals with primary HIV infection. Patients are grouped on the basis of the three patterns (Type 1, Type 2, and Type 3) of Vβ perturbations. The results are shown only for those Vβs that were found significantly perturbed (>2-fold) during the longitudinal analysis; the numerical values shown corresponded to those detected at the time point in which the greatest change in fold increase was observed. The shaded box indicates that no significant changes were observed. (A) Results are expressed as fold increase and/or decline. (B) Percentages of the individual Vβs for which the changes in fold increase and/or decline have been shown in A. With regard to Vβ6 in patient 22, the percentage was very high (24%) at day 43, and progressively declined to 14% at day 106. Samples at later time points were not available; for this reason, the changes in Vβ6 were considered significant even if they were <2-fold. With regard to the changes of Vβ17 in patient 7, and Vβ8 in patients 15 and 18, the increments in the percentage of these Vβs were observed at later time points when the percentages of the other Vβs that were found to be perturbed had already declined. The Vβ repertoire was analyzed by a semi-quantitative PCR assay (21, 24, 29).

