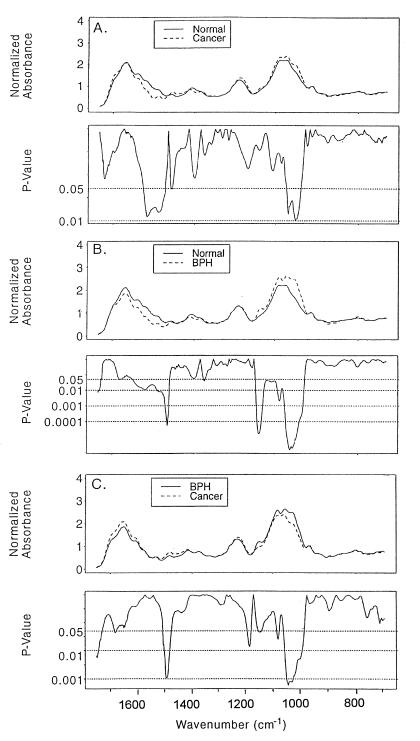
Figure 2.
Comparison of the mean spectrum of cancer vs. normal tissue (A), BPH vs. normal tissue (B), and cancer vs. BPH (C). The lower plot of each panel shows the statistical significance of the difference in mean absorbance at each wavenumber, based on the unequal variance t test. P values are plotted on the log10 scale.

