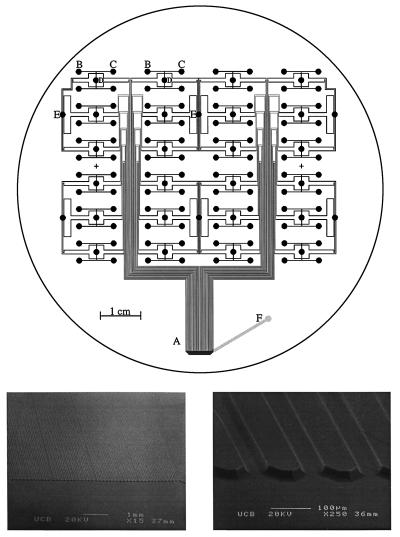
Figure 1.
(Upper) Mask pattern for the 96-sample capillary array electrophoresis microplate. A is the detection region, B and C are injection reservoirs, D are waste reservoirs, E are cathode reservoirs, and F is the anode. The diameter of the circle indicates the 10-cm wafer sized substrate. (Lower) The scanning electron micrograph on the Left shows all 48 channels spaced 150 μm apart with a 200-μm spacing every 12 channels. The scanning electron micrograph on the Right presents a close-up of a portion of the array showing the 21-μm-deep etched channels.

