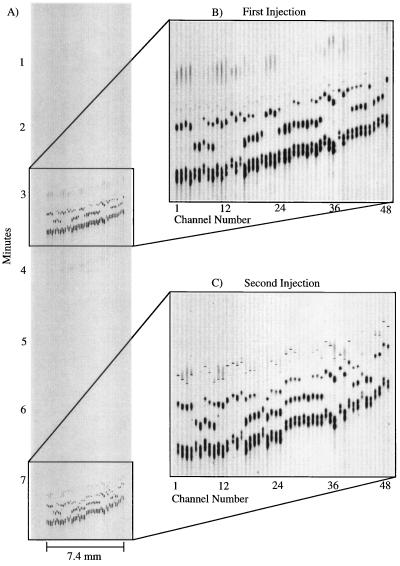
Figure 5.
(A) Image of 96 RsaI-digested HFE amplicons analyzed in two sequential 48-sample separations. (B and C) Expanded views of the separation image from the first and second injection, respectively. The total time for the two separations was less than 7.6 min. Samples were separated on 0.75% (wt/vol) hydroxyethylcellulose in 1× TBE buffer with 1 μM ethidium bromide in the running buffer. The channels were 10 cm in length from the injection to the detection region. The injection was performed as described in the text and the applied fields for injection and separation were 300 V/cm.

