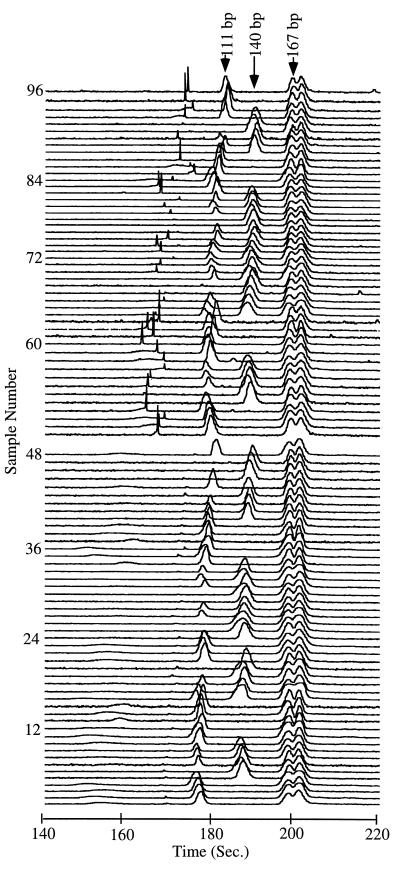
Figure 6.
Electropherograms generated from the image of 96 HFE separations presented in Fig. 5. The electropherograms have been shifted by up to 10% to align the constant doublet peak at 167 bp. The three genotypes are characterized by (i) a single peak at 140 bp corresponding to the 845G type, (ii) a single peak at 111 bp corresponding to the 845A type, and (iii) the heterozygote type, which exhibits both the 140-bp and 111-bp peaks. Because the intensity of intercalation dye labeling is proportional to DNA fragment size, the 29-bp fragment is not observable in these displays.

