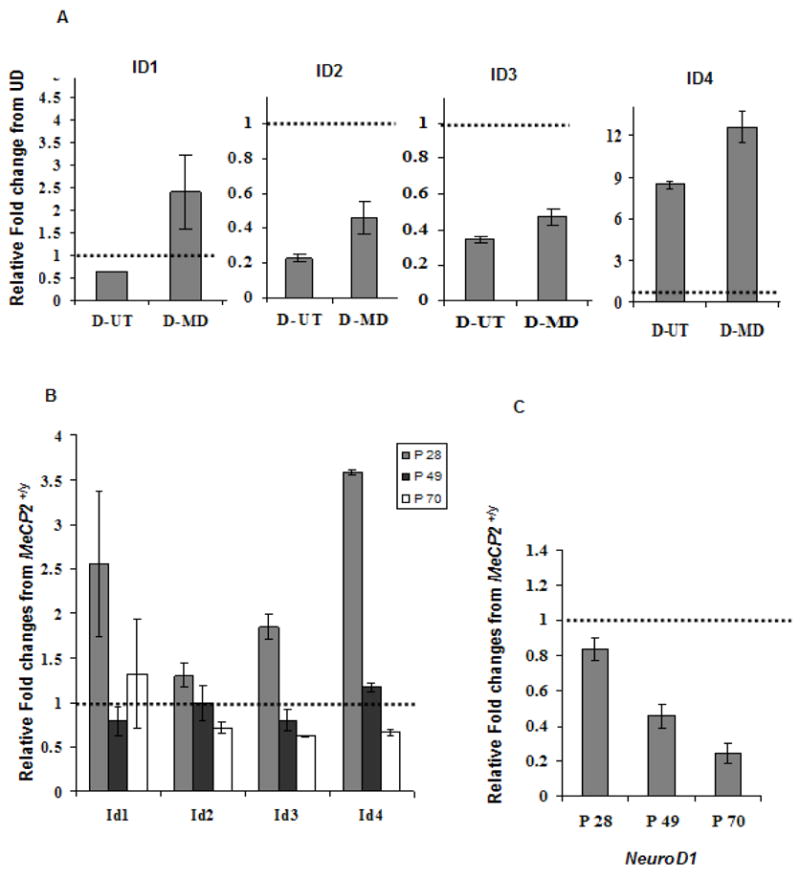
Figure 1. Quantitative RT-PCR results for ID1-4 in SH-SY5Y, Mecp2−/y mouse brain cDNA and NeuroD1, a downstream target of ID genes.

A, B and C: Graphical representation of all four ID genes qPCR data reflect fold changes relative to the control (set to 1.0, indicated by hatched bar) following normalization of the data to GAPDH house keeping control using the comparative CT method. A) The qPCR data for ID1, ID2 and ID3 genes show a decreased expression with differentiation, in untransfected SH-SY5Y cells (D-UT) and increased expression with MeCP2 decoy (D-MD). qPCR data of ID4 shows an increased expression level following SH-SY5Y differentiation. ID4 was further increased in the D-MD transfected cells compared to 48 h untransfected (D-UT). Results shown represent mean ± SEM of three replicate experiments. B) The qRT-PCR was conducted in cDNA samples from Mecp2−/yand Mecp2+/ymice brains. The relative fold change differences for all four ID genes were higher in the Mecp2−/y compared to Mecp2+/yat P28 time point, and reached significance by t-test for Id3 and Id4 (P < 0.05). No increase in cDNA was observed at later time points (P49 and P70). C) The qRT-PCR results on a downstream target of ID genes, NeuroD1, showed lower expression in all three postnatal time points (P28, P49 and P70) in Mecp2−/y brain compared to the Mecp2+/y control brain, with significantly reduced expression at P49 and P70 by t-test (P ≤ 0.05). Each time point in bar graphs B and C represents mean ± SEM of three replicate experiments from two pairs of mice per time point.
