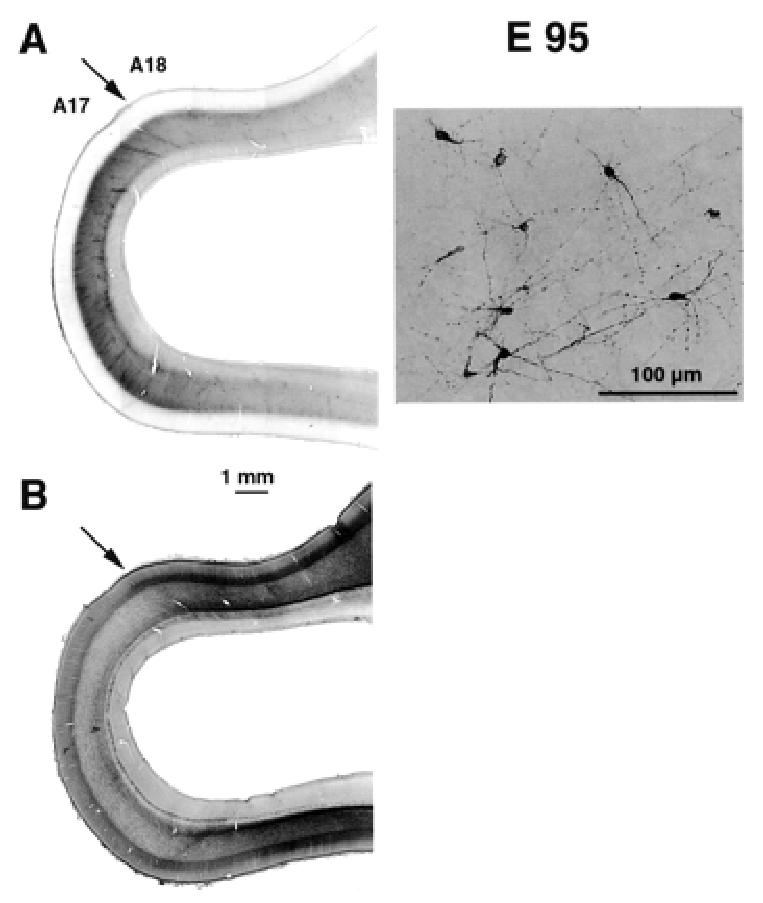
Figure 7.

Identification of subplate and areal borders at E95. (A) Neuropeptide Y labelling identifies the subplate. Low magnification (left panel) shows that there is a difference in the intensity of labelling in the region of the putative area 17/18 border. This is due to changes in the density of labelled subplate neurons (right panel). (B) Adjacent section reacted for acetylcholinesterase activity. This confirms the location of the area 17/18 border (for further details, see Fig. 6).
