
Figure 4.
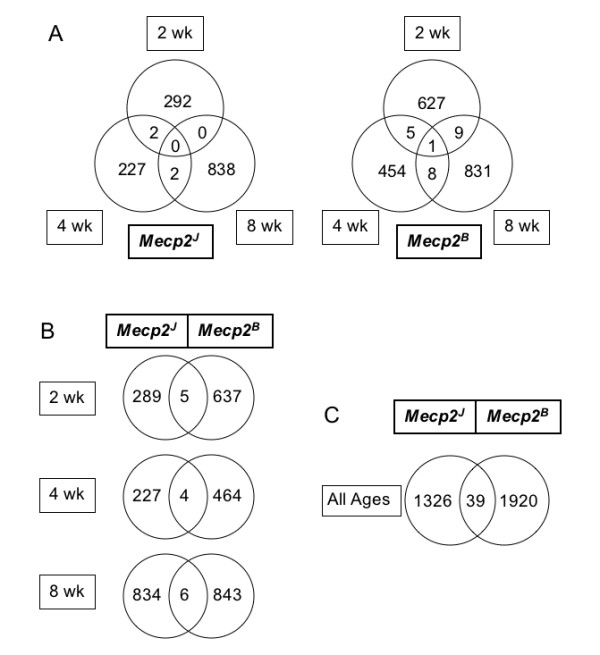
Differentially expressed genes (DEG) in cerebellum microarray study. A. Overlap of DEG at 2 wk, 4 wk, and 8 wk time points. For both mutant alleles, genes whose transcripts were either increased (1.2-fold or higher) or decreased (0.8-fold or lower) at P < 0.05 are included. Transcripts in the overlap regions are described in Additional file 1. B. Overlap of DEG across both mutant alleles at three time points. The same criteria as in Figure 4A were applied. C. Overlap of DEG across all ages in both mutant strains. The 39 transcripts include the 15 overlapping DEG from Figure 4B as well as genes that were significantly changed at one age in one mutant and at another time point in the other mutant. The list is provided in the Additional file 1.