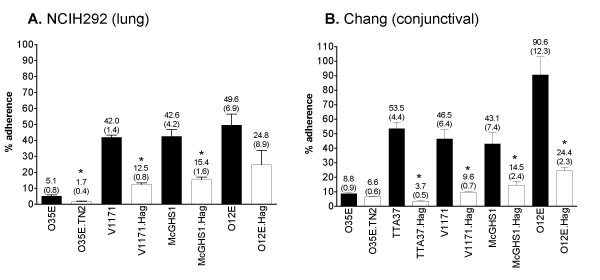
Figure 1.

Adherence of M. catarrhalisstrains to NCIH292 (Panel A) and Chang (Panel B) cells. Black bars correspond to WT isolates and hag isogenic mutant strains are represented by open bars. The results are expressed as the mean (± standard error) percentage of inoculated bacteria binding to monolayers. The number above each bar represents mean percentage; standard error is shown in parentheses. Asterisks indicate that the difference in adherence between a WT strain and its respective hag mutant is statistically significant.
