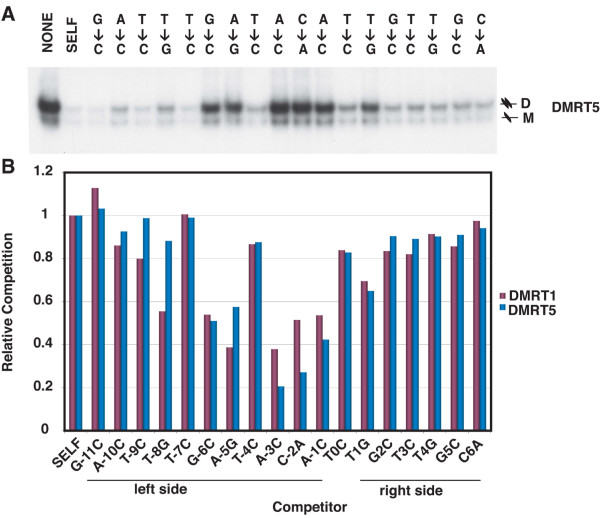
Figure 3.

Comparison of DNA binding preferences of DMRT1 and DMRT5. Top panel: competitive gel mobility shift using the same probe and competitors as in Figure 1A, testing binding by in vitro translated DMRT5. Positions of monomeric and dimeric complexes are indicated ("M" or "D"). Bottom panel: effectiveness of competitor DNAs. Quantitation of data from top panel and Figure 1A, with competition by perfect DMRT1 site ("SELF") set at 1.0.
