
Figure 3.
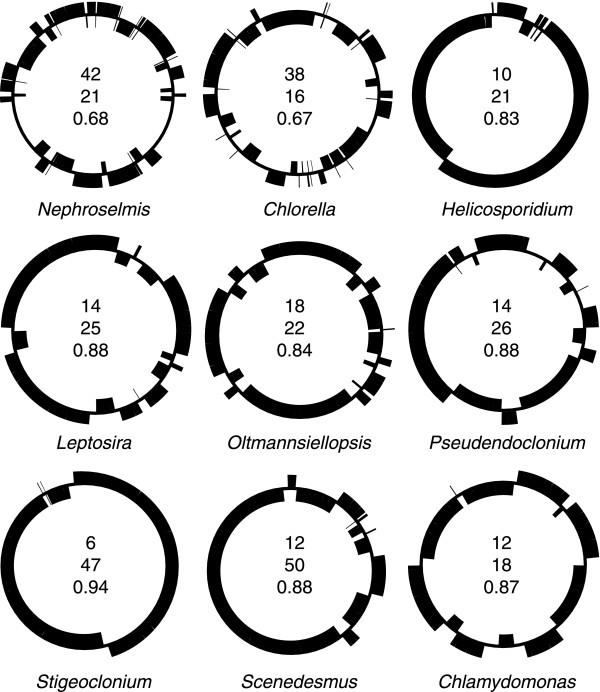
Distributions of genes on the two DNA strands in Leptosira and other green algal cpDNAs. Black boxes denote blocks of adjacent genes on the same DNA strand. For each genome, the total number of gene blocks (top number), the maximum number of genes observed in a block (middle number) and the sidedness index Cs (bottom number) are indicated.