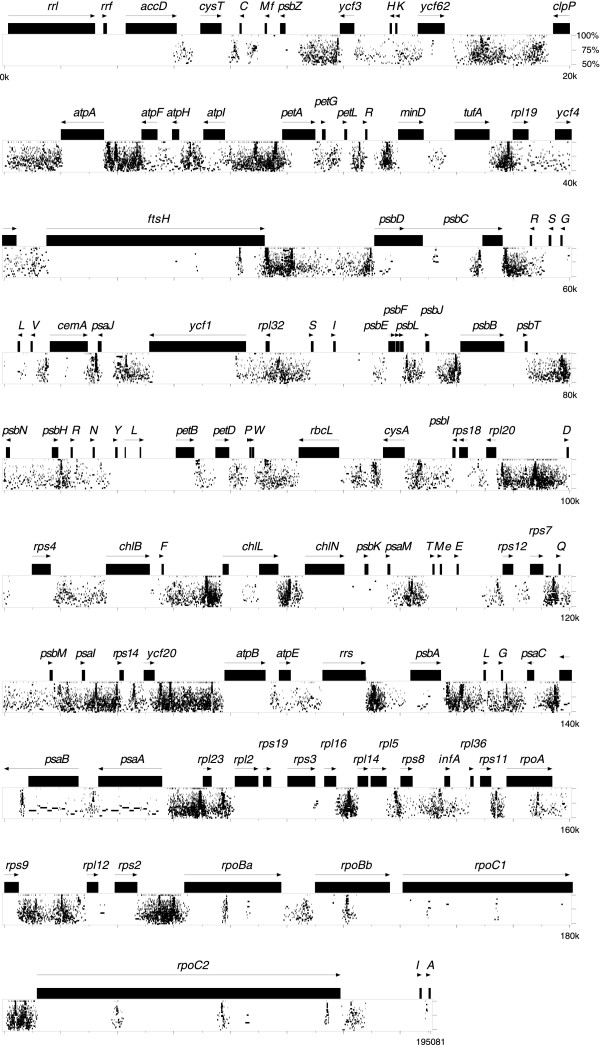
Figure 5.

PipMaker analysis of Leptosira cpDNA. The genome sequence was aligned against itself. Similarities between aligned regions are shown as average percent identity (between 50% and 100% identity). Genes and their polarities are denoted by horizontal arrows and coding sequences are represented by filled boxes.
