
FIGURE 1—
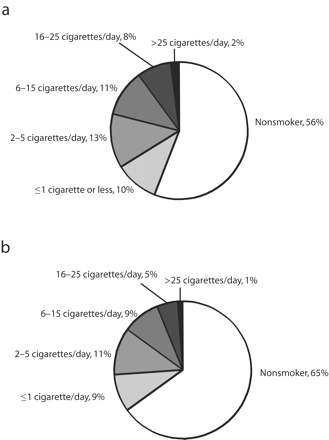
Example of a normative feedback graphic for use with young adult smokers showing actual smoking rates of young adult smokers aged 25–29 years for (a) men and (b) women.
Source. From reference 11.
Official websites use .gov
A
.gov website belongs to an official
government organization in the United States.
Secure .gov websites use HTTPS
A lock (
) or https:// means you've safely
connected to the .gov website. Share sensitive
information only on official, secure websites.
Example of a normative feedback graphic for use with young adult smokers showing actual smoking rates of young adult smokers aged 25–29 years for (a) men and (b) women.
Source. From reference 11.