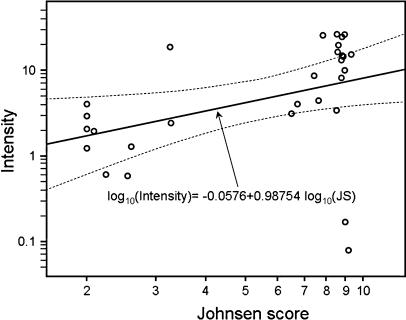
Fig. 6.
Scatter plots of histological Johnsen score (JS) and Cx43 immunostaining intensity, with both measurements expressed on base 10 log-scale. Open circles depict the measurements. Solid line indicates the regression line for log10 (JS) and log10 (intensity), while the two dotted curves depict the 95% confidence limits for the population regression line.

