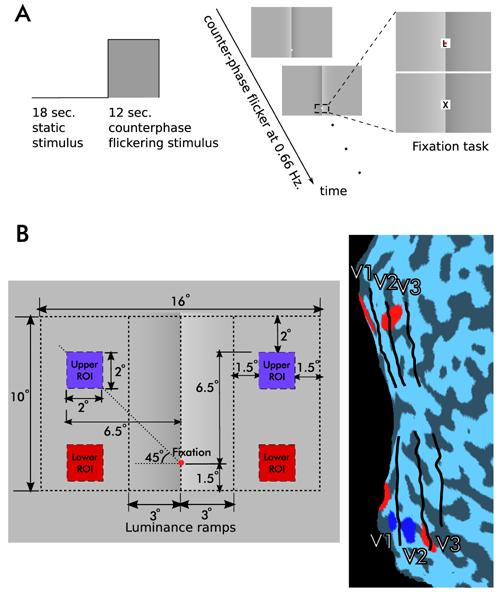
Figure 3. Design of the fMRI experiment.

Cortical responses were measured to dynamically presented versions of the stimuli shown in Figure 1. The contrast of the “Real” stimulus was adjusted to match the lightness effect for each observer based on his or her behavioral data.
(A) Each stimulus was first presented statically for 18 seconds followed by a square wave modulated counterphase flicker for 12 seconds. During the entire scan observers performed a fixation task that required them to detect a target letter (X) among distracters during rapidly changing presentation of these letters.
(B) Region of interest (ROI) definitions. Counterphase flickering checker patterns were used to localize ROIs. The left panel shows dimensional parameters of the “Illusory” stimulus and the positions of the ROI localizers. The right panel shows the areas of the visual cortex activated by the localizers for one observer (p(corr.)<10−4). Red lower ROIs, blue upper ROIs. Because the cortical areas corresponding to upper ROIs were much closer to the vertical meridian and therefore to the contrast border in the stimuli, only MR data in lower ROI pairs are presented here (See Supplemental Figure 1 for results from both ROI pairs).
