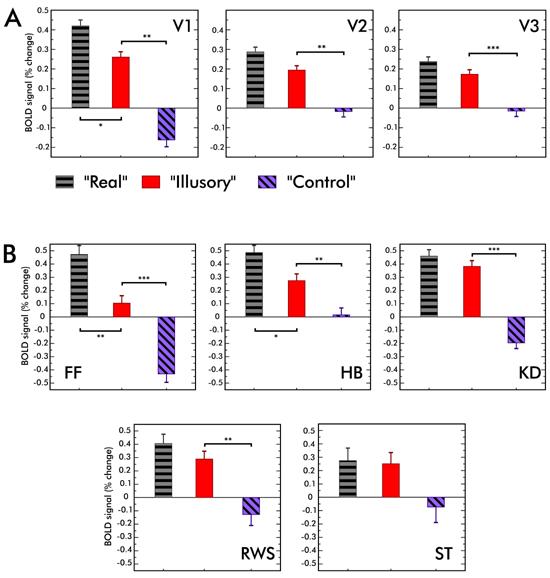
Figure 4. FMRI results.

(A) V1, V2, and V3 responses averaged across observers. The average response to the “Illusory” condition was smaller than that to the “Real” condition. However this difference was statistically significant only in V1. Importantly, the MR signal to “Illusory” condition was larger than that to the “Control” stimulus in V1, V2 and V3. The difference between the MR signals to “Illusory” and “Control” conditions suggest that the activity in “Illusory” condition can not be explained as a direct response (neural or vascular) to distant contrast and luminance variations. (See Supplemental Figure 1 for the analysis of MR data in both ROI pairs).
(B) Individual responses in V1. For two observers out of five, MR signals to “Real” condition was statistically significantly larger than that to the “Illusory” condition. For all observers except one, the “Illusory” stimulus evoked a significantly larger MR signal than the “Control” stimulus. Error bars represent one standard error of the mean (s.e.m.). Statistically significant differences are indicated (* p<0.05, ** p<0.01, *** p<0.001).
