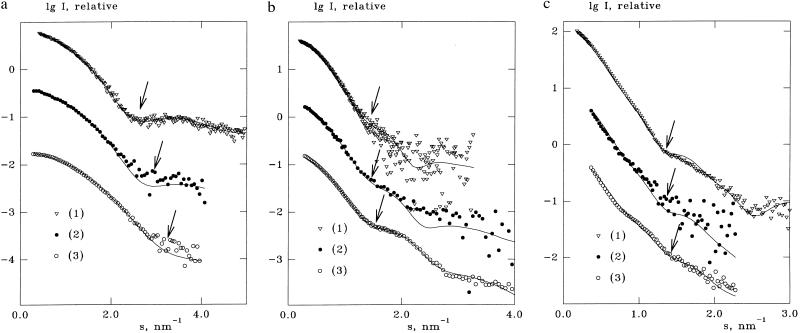
Figure 2.
Fit to the experimental data by crysol and cryson for lysozyme (a), TR (b), and R1 (c). Symbols represent the experimental curves; solid lines represent the best fits calculated from the atomic models with the hydration shell. Fits (1)–(3) correspond to x-rays, neutrons in H2O, and neutrons in D2O, respectively. Arrows indicate the onset of the first shoulder for each curve.

