
FIGURE 1.
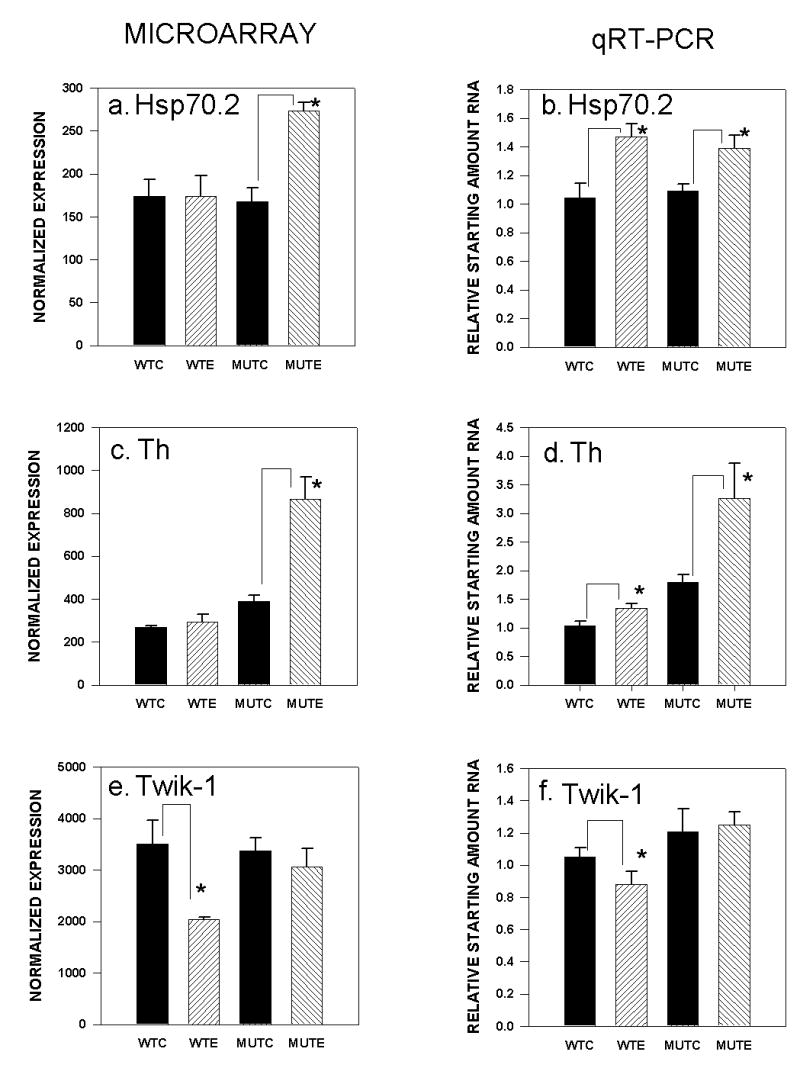
Gene expression changes in PKCγ mutant and wild-type mice after chronic ethanol diet as measured by microarray chip analyses (panels a., c., e.) with confirmation by qRT-PCR analyses of independent samples (panels b., d., f.). WTC: wild type control diet; WTE: wild type ethanol diet; MTC: mutant control diet; MTE: mutant ethanol diet. a.) Heat shock protein 70.2 microarray; * p < 0.05 increase after ethanol diet); b.) Heat shock protein 70.2 qRT-PCR; * p < 0.001 increase after ethanol diet); c.) Tyrosine hydroxylase microarray, *p < 0.05 increase after ethanol diet; d.) Tyrosine hydroxylase qRT-PCR, * p < 0.02 increase after ethanol diet; e.) Twik-1 microarray, * p < 0.05 decrease after ethanol diet; f.) Twik-1 qRT-PCR, * p < 0.03 decrease after ethanol diet.