
Figure 1.
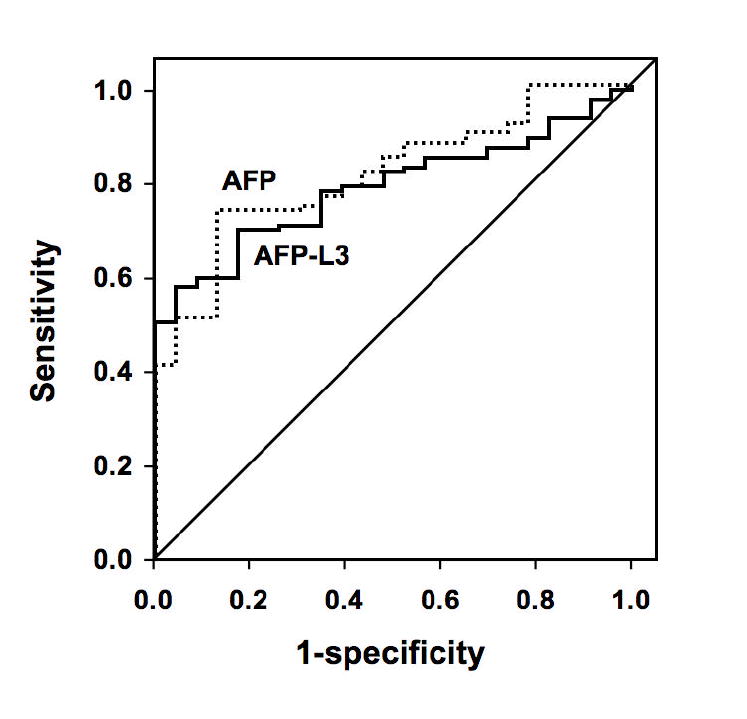
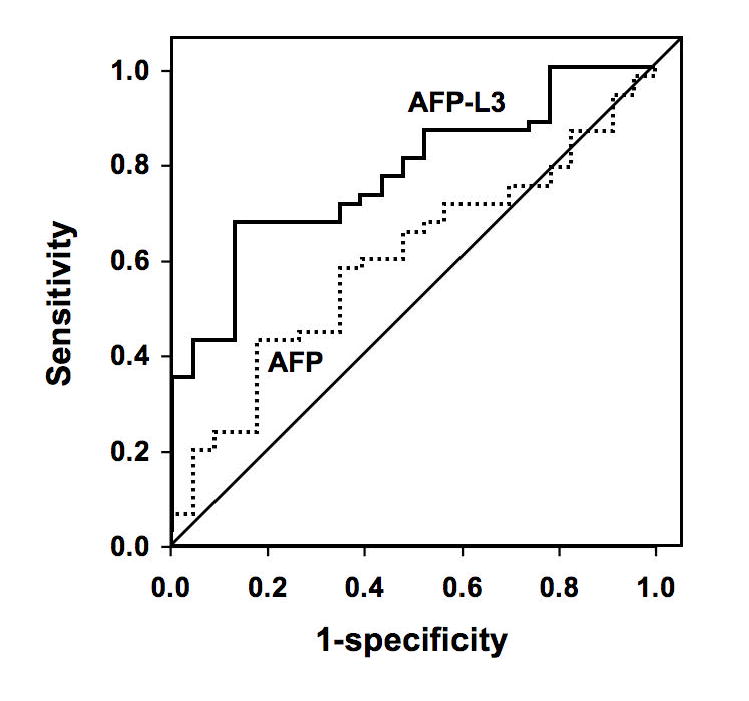
Figure 1A. Receiver operating characteristic (ROC) curves comparing total AFP with AFP-L3% for diagnosis of HCC in individuals with total AFP greater than 10 ng/ml.
Figure 1B. ROC curves comparing total AFP with AFP-L3% for diagnosis of HCC in individuals with total AFP between 10 and 200 ng/ml.