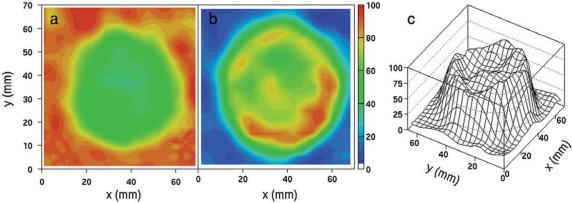
Figure 3.
A Ge/Ga-based attenuation map (a) and a attenuation-corrected FDG-PET image of a sphere with a diameter of 60 mm in a water environment (b,c) (Siemens ECAT Exact 47, Siemens/CTI, USA). The scale is such that ‘zero’ corresponds to no recovery and ‘100’ to full recovery. The activity concentration in the sphere was 100 kBq/ml. Instead of a close to uniform attenuation map, we observe a depletion in the attenuation coefficient in the sphere (a), due to the emission contamination. Consequently, the activity concentration derived from the corrected PET image is underestimated by tens of percent (b,c).

