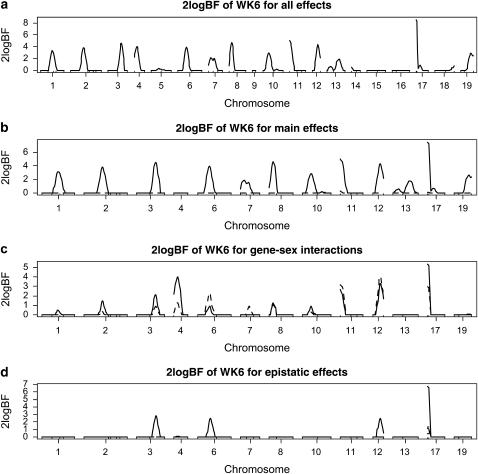
Figure 1.—
F2 data analysis with independence priors on the indicator variables γ and the new Metropolis–Hastings algorithm profiles of Bayes factors (rescaled as 2 logeBF and negative values are truncated as zero): (a) for all combined effects (additive, dominance, epistatic, and gene–sex effects); (b) for main effects, solid and dashed lines represent additive and dominance effects, respectively; (c) for gene–sex interactions, solid and dashed lines represent additive–sex and dominance–sex interactions, respectively; (d) for epistatic interactions, solid lines represent additive–additive interactions and other epistatic effects were not detected. On the x-axis, outer tick marks represent chromosomes and inner tick marks represent markers.

