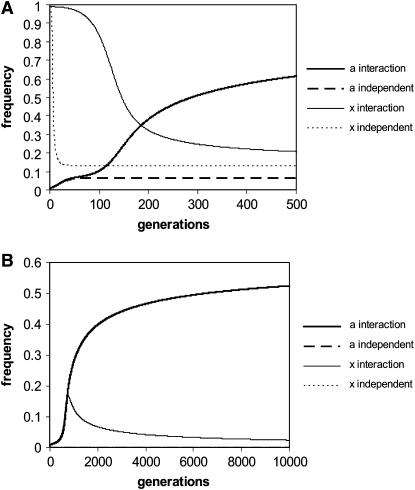
Figure 2.—
(A) The trajectory of x and a frequencies with the following starting conditions: x = 0.99, a = 0.01, w = wh = 2, v = vh = 0.2. The two-locus system is indicated with solid lines and the single-locus expectation (which is not dependent on an epistatic interaction) is indicated with dashed lines. (B) The trajectory of x and a frequencies with sex-averaged fitness of 0.9 for the autosomal allele δ (relative to a fitness of 1 for non-δ-, non-ξ-genotypes). The starting conditions were a = 0.01, x = 0.01, w = wh = 1.5, v = vh = 0.3. Note that the single-locus curves are also plotted but they quickly drop to a frequency of zero.

