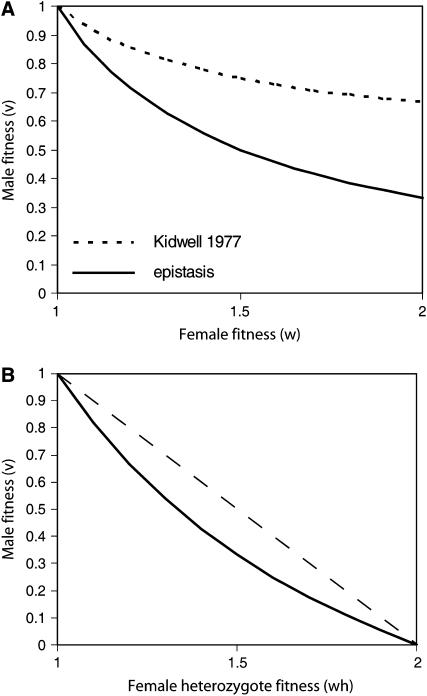
Figure 5.—
(A) A plot of the minimum male fitness vs. female fitness required to make the fixation point x = 1, a = 1 an unstable equilibrium. In this plot wh and vh were set equal to one (which assumes recessive effects of the heterozygotes). The line labeled Kidwell 1977 refers to the single-locus, harmonic mean result of Kidwell et al. (1977). (B) A plot of the minimum male fitness vs. female fitness required to make the fixation point x = 0, a = 1 an unstable equilibrium. The solid line indicates the minimum male fitness (v). The area below the dashed line has an average fitness of less than one.

