Figure 1.—
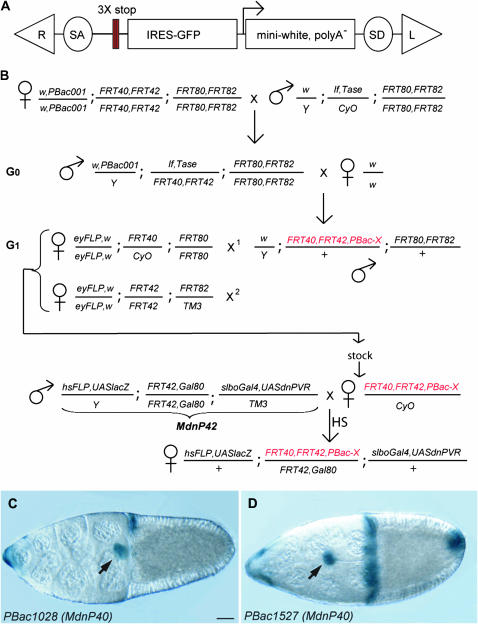
The PiggyBac screen. (A) The PiggyBac vector used as a mutagen. R and L are the right and left feet of the PBac transposon. SA and SD are the splice acceptor and splice donor. The three stop codons, one in each frame, are represented as red bars. (B) The crossing scheme. PBac001 indicates the jump starter. Tase indicates the piggyBac transposase. G0, generation of new insertion. G1, mapping. The new mutated chromosome, carrying a w+ insertion, is represented in red. FRT40,FRT42 is indicated as an example but it could also be FRT80,FRT82, as the crosses are identical. X1 and X2 are the two successive crosses done with single males, progeny of G0, to map the insertion to a chromosome arm. In the MdnP cross, virgins from the PBac stocks are crossed with MdnP males. The genotype of the MdnP42 male is shown as example for a PBac insertion distal to FRT42. Heat shock (HS) is applied to the progeny, either at larval stage or at adult stage. Females are dissected and ovaries are stained with X-Gal. An example of insertion with a border cell migration delay phenotype is shown in D; compare to an insertion with no phenotype (C). (C and D) X-gal-stained stage 10 egg chambers from females of the genotype hsFLP,UAS-lacZ/+;PBac1028,FRT40,FRT42/tub-Gal80,FRT40; slbo-Gal4,UASdnPVR/+ (C) and hsFLP,UAS-lacZ/+ ; PBac1527,FRT40,FRT42/tub-Gal80,FRT40;slbo-Gal4,UASdnPVR/+ (D). Arrow indicates the border cell cluster. Bar, 20 μm. Here and in all figure panels, anterior is to the left.

