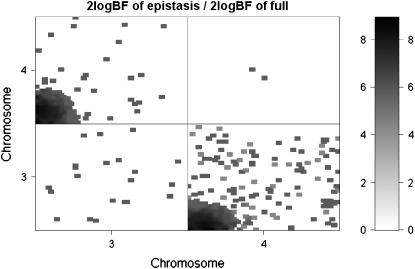
Figure 3.—
Real F2 data analysis with the ordinal probit model: two-dimensional profiles of Bayes factors (rescaled as 2 logeBF and negative values are truncated as zero). Top triangle shows Bayes factor of epistasis only; bottom triangle shows Bayes factor comparing full model with epistasis to no QTL.

