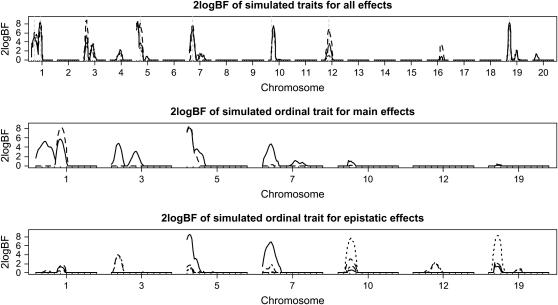
Figure 5.—
Simulated F2 data analyses: one-dimensional profiles of Bayes factors (rescaled as 2 logeBF and negative values are truncated as zero). (Top) For all combined effects (additive, dominance, and epistatic effects) for all three analyses: solid, dashed, and dotted lines represent analyses with the ordinal probit model, the continuous trait, and the model treating the ordinal phenotype as a continuous trait, respectively. Vertical shaded dashed lines show true location of QTL. (Middle) For main effects on the selected chromosomes (solid and dashed lines represent additive and dominance effects, respectively). (Bottom) For epistatic interactions on the selected chromosomes (solid, dotted, and dashed lines represent additive–additive, additive–dominance, and dominance–additive interactions, respectively). On the x-axis, outer tick marks represent chromosomes and inner tick marks represent markers.

