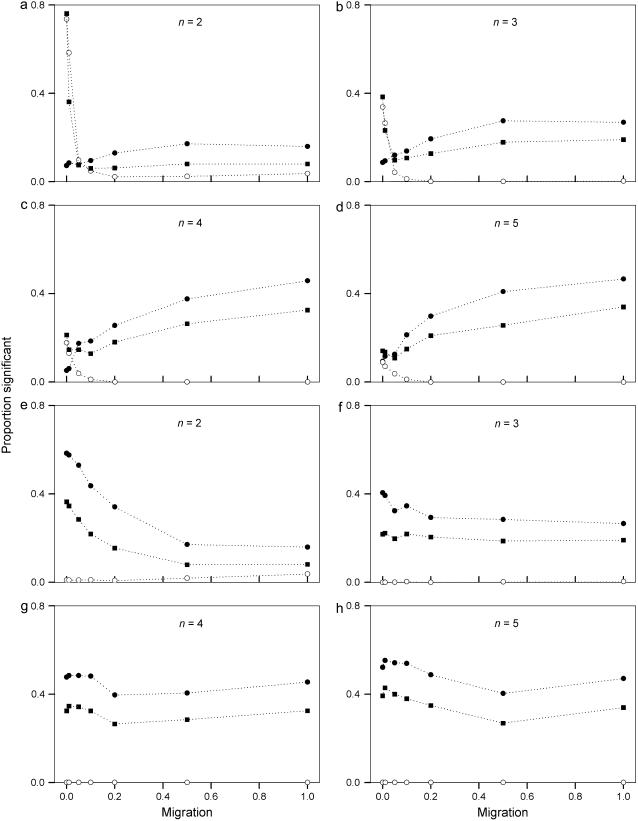
Figure 7.—
Proportion of allele-frequency vectors that were significantly different from neutral according to the Ewens–Watterson test for neutrality. Samples were taken from frequency vectors taken from one of the demes (a–d) and from pooled frequency vectors from both demes (e–h) for two, three, four, and five alleles. Allele-frequency vectors were rejected if 18 or more of the generated sample homozygosity ( ) values were lower (solid circles) or higher (open circles) than the critical points of Ewens sampling distribution (see text for explanation). Also shown is the overall proportion of significant tests in either region (solid squares).

