
Figure 8.
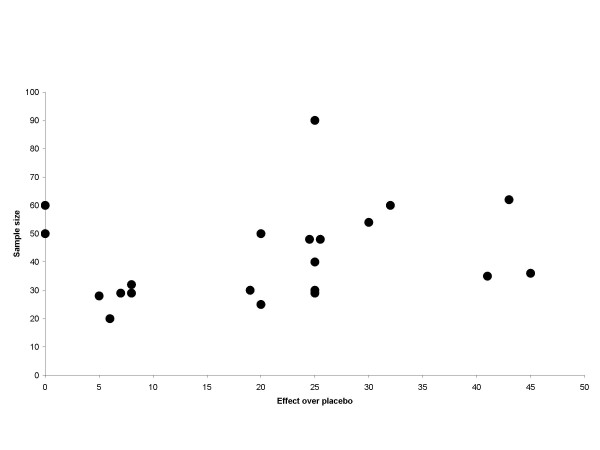
Publication bias plot. Effect/size plot for trials with TENS/IF, LLLT and EA. Black circles indicate a single trial. Effect over placebo is related to teh x-axis and sample size is related to the y-axis.
Official websites use .gov
A
.gov website belongs to an official
government organization in the United States.
Secure .gov websites use HTTPS
A lock (
) or https:// means you've safely
connected to the .gov website. Share sensitive
information only on official, secure websites.
Publication bias plot. Effect/size plot for trials with TENS/IF, LLLT and EA. Black circles indicate a single trial. Effect over placebo is related to teh x-axis and sample size is related to the y-axis.