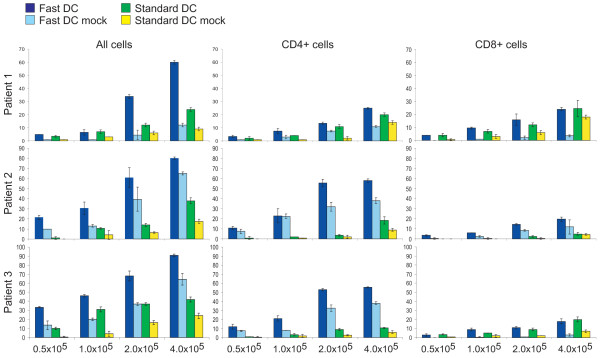
Figure 4.

ELISPOT analysis of T-cell activation. T cells were stimulated with DCs transfected with tumor mRNA or control DCs (mock transfected) as indicated. Mean number of IFN γ positive spots from duplicate wells obtained with the indicated numbers of un-fractionated T cells, and CD4+ and CD8+ T-cell subsets from individual patients. Results are presented as mean +/- standard deviation (SD).
