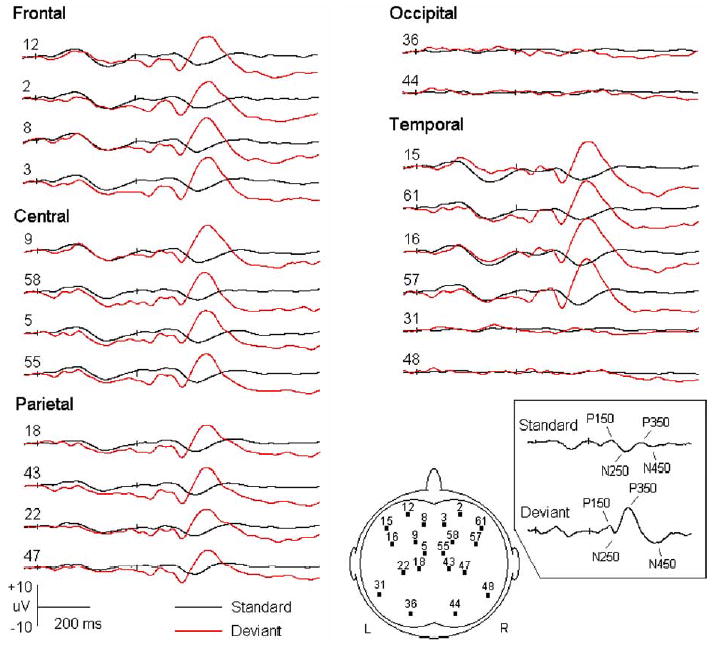
Fig. 1.

Grand averaged event-related potentials (ERPs) to standard and deviant stimuli (five subjects at 12 months of age). The onsets of the tone pairs are indicated by small ticks (at 0 and 370 ms, respectively). Out of the 62 channels, only a few waveforms are displayed to represent different brain areas. The number in front of each wave indicates the position of corresponding electrode. Its location is also demonstrated in the figure that represents the scalp. The ERP components induced by the standard and deviant tones are indicated in the box (those to the first tones are not shown).
