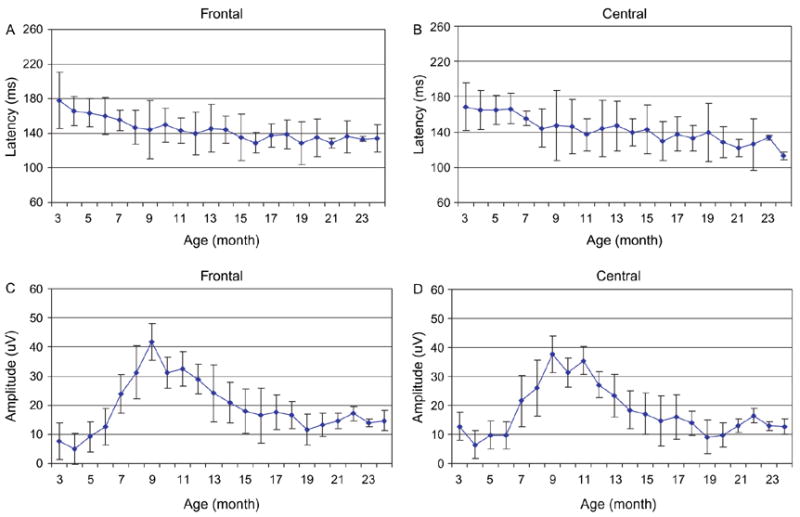
Fig. 3.

Comparisons of P150 latencies to the standard stimuli in the frontal (A) and central (B) areas and amplitudes in the frontal (C) and central (D) areas (five subjects, shown as mean ± SD). The amplitude was calculated as differences between the N250 and P350 amplitudes.
